

Audience Demographics & Breakdown
Understand who is participating in conversations about your brand by exploring demographic attributes available in the Demographics tab.


Understand who is participating in conversations about your brand by exploring demographic attributes available in the Demographics tab.
The Demographics section in Kommon Poll provides insights into the composition of your audience based on data extracted from user profiles and platform-reported attributes. This helps you analyse who is engaging in conversations across several dimensions such as age, gender, nationality, language, location, occupation, and account type.
Note: Demographic availability varies by platform. Some charts may reflect only a subset of total mentions depending on which attributes are accessible.
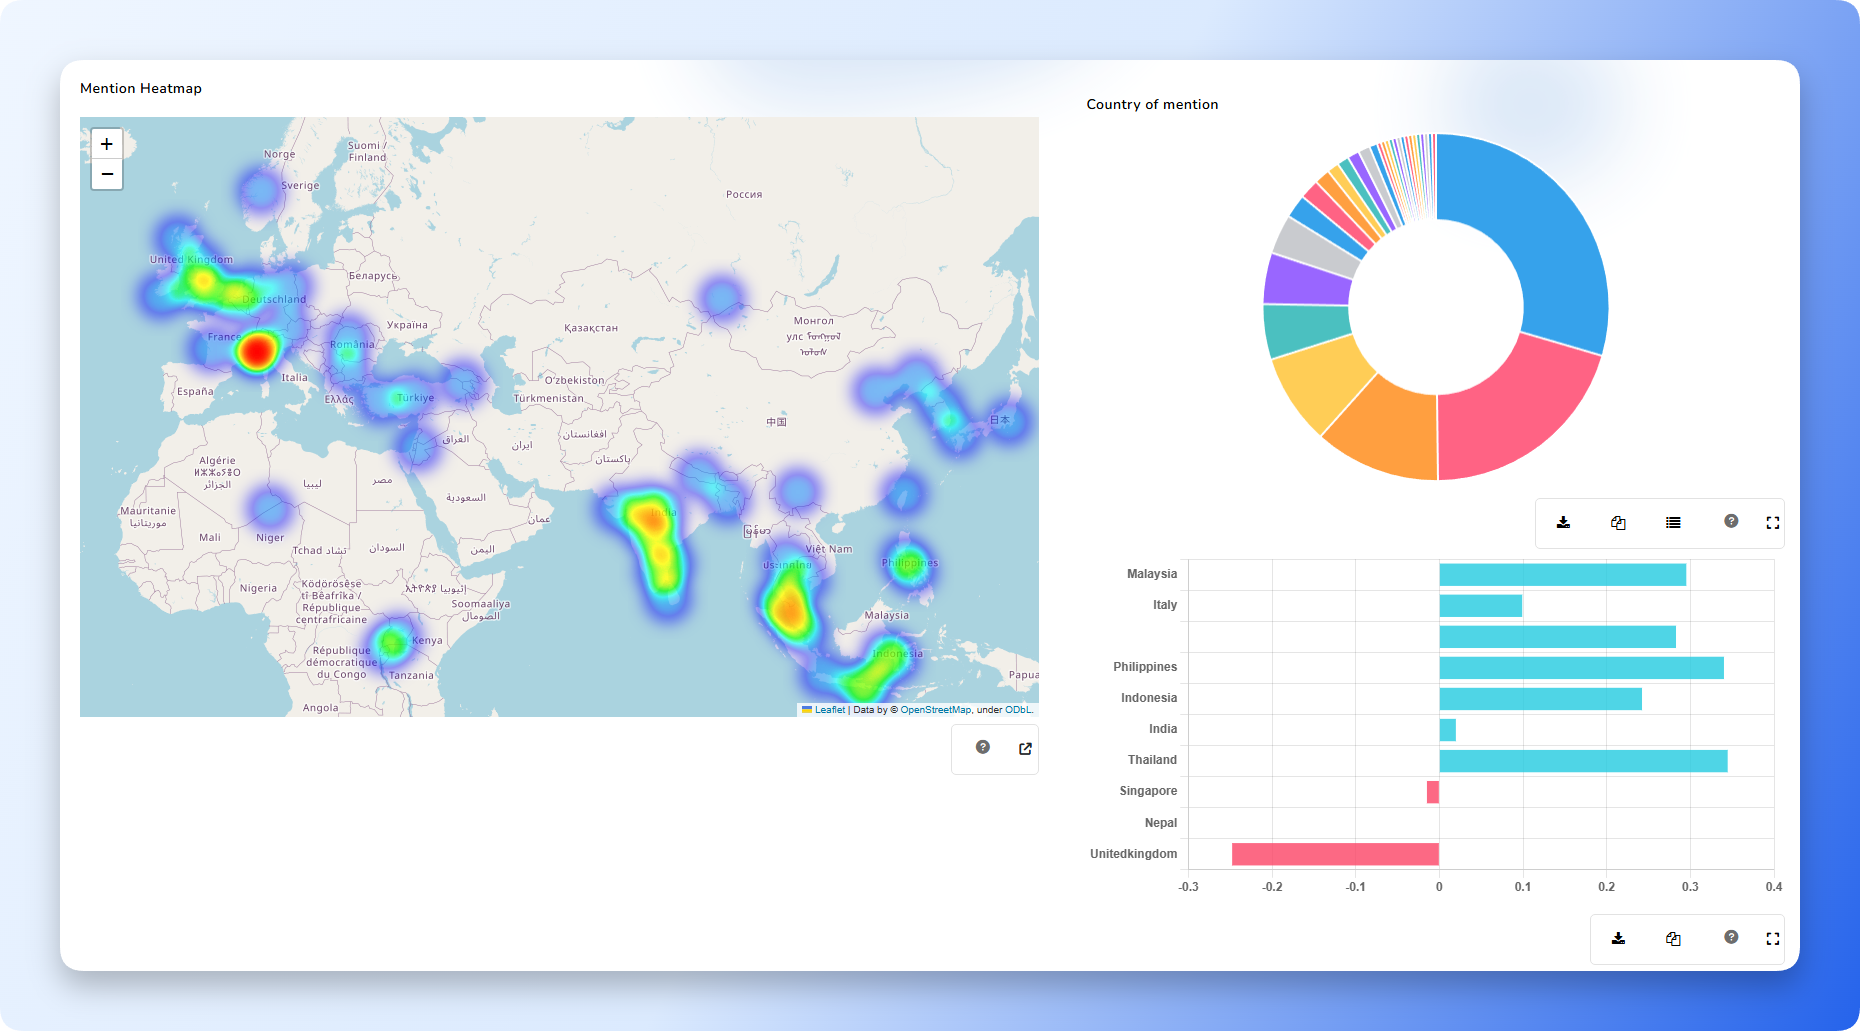
8.1.1 Geographic Distribution
The Demographics tab provides multiple levels of geographic insight:
- Country distribution — where mentions originate globally.
- Regional or state distribution — where supported.
- Heatmap view — visualising conversation density across geographic areas.
These visualisations help identify audience locations, regional engagement trends, and geographical patterns.
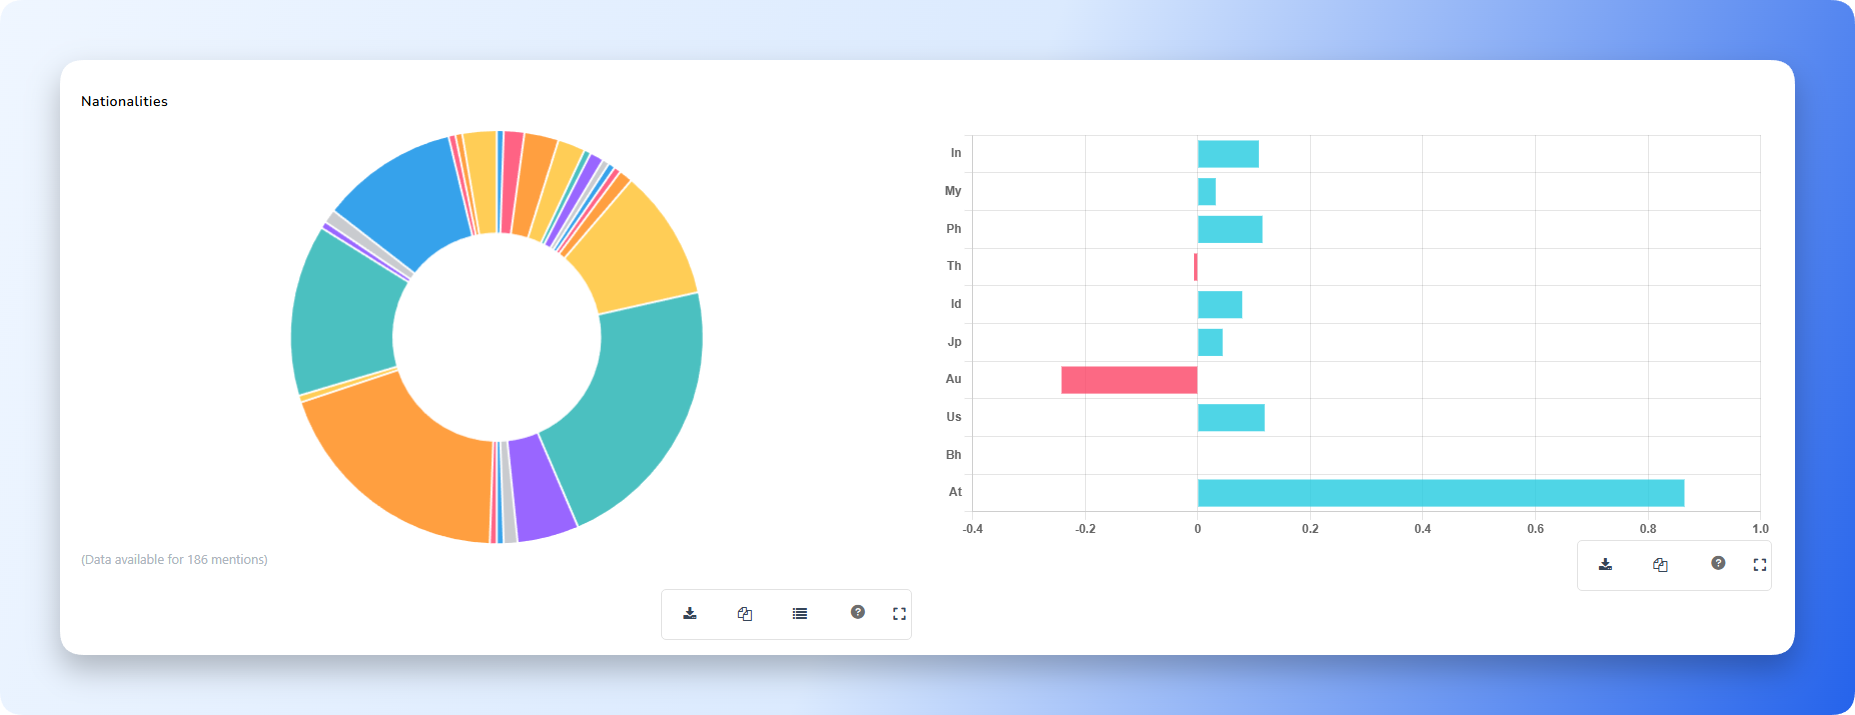
8.1.2 Nationality Breakdown
The nationality chart groups authors by detected or declared nationality.
This supports:
- Understanding cultural diversity.
- Identifying dominant or emerging national groups.
- Noticing cross-border participation around your brand.
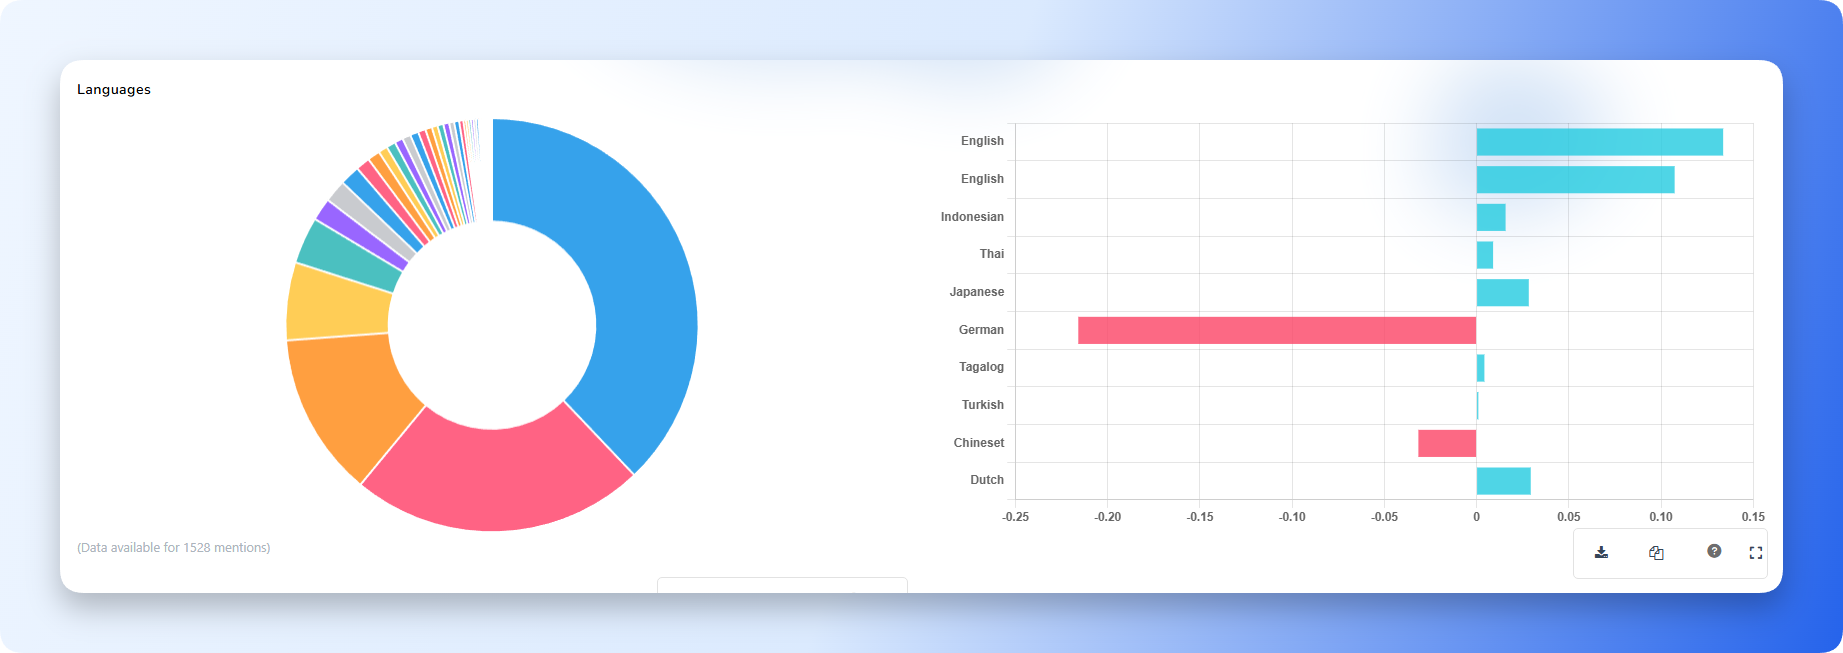
8.1.3 Language Distribution
The language chart displays the languages used within mentions.
This helps you:
- Understand linguistic diversity.
- Identify primary languages used by your audience.
- Plan content and support for multilingual users.
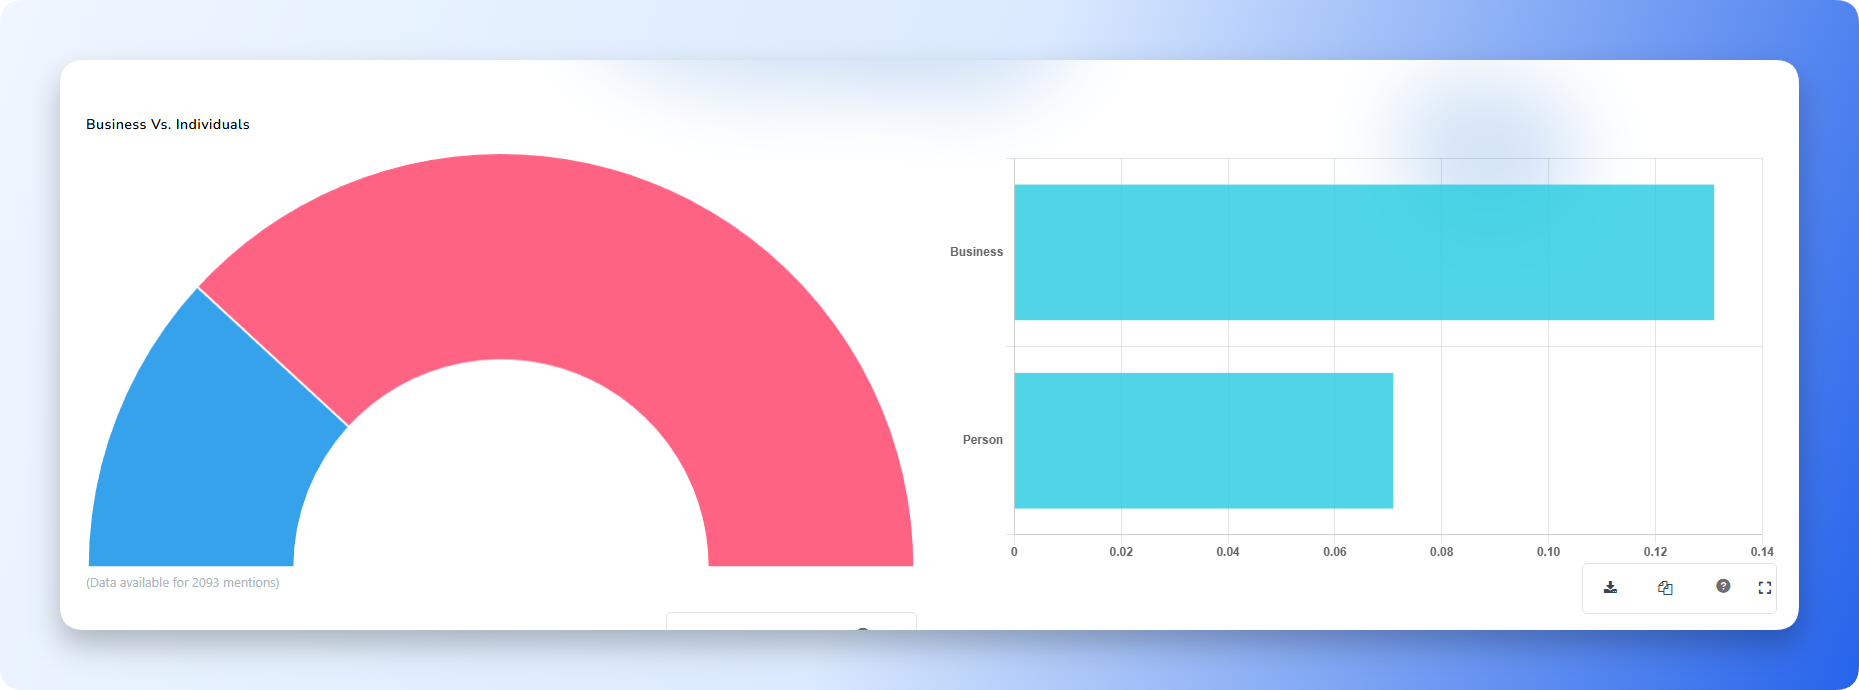
8.1.4 Business vs Individuals
This section differentiates between:
- Business or organisational accounts
- Individual or personal accounts
This helps you understand whether conversations are driven more by companies or everyday users, supporting B2B/B2C strategic decisions.
8.1.5 Gender Distribution
Where platforms provide gender metadata, the gender distribution chart shows the proportion of mentions attributed to each gender category.
This insight helps you:
- Identify gender representation in conversations.
- Check alignment with your target customer base.
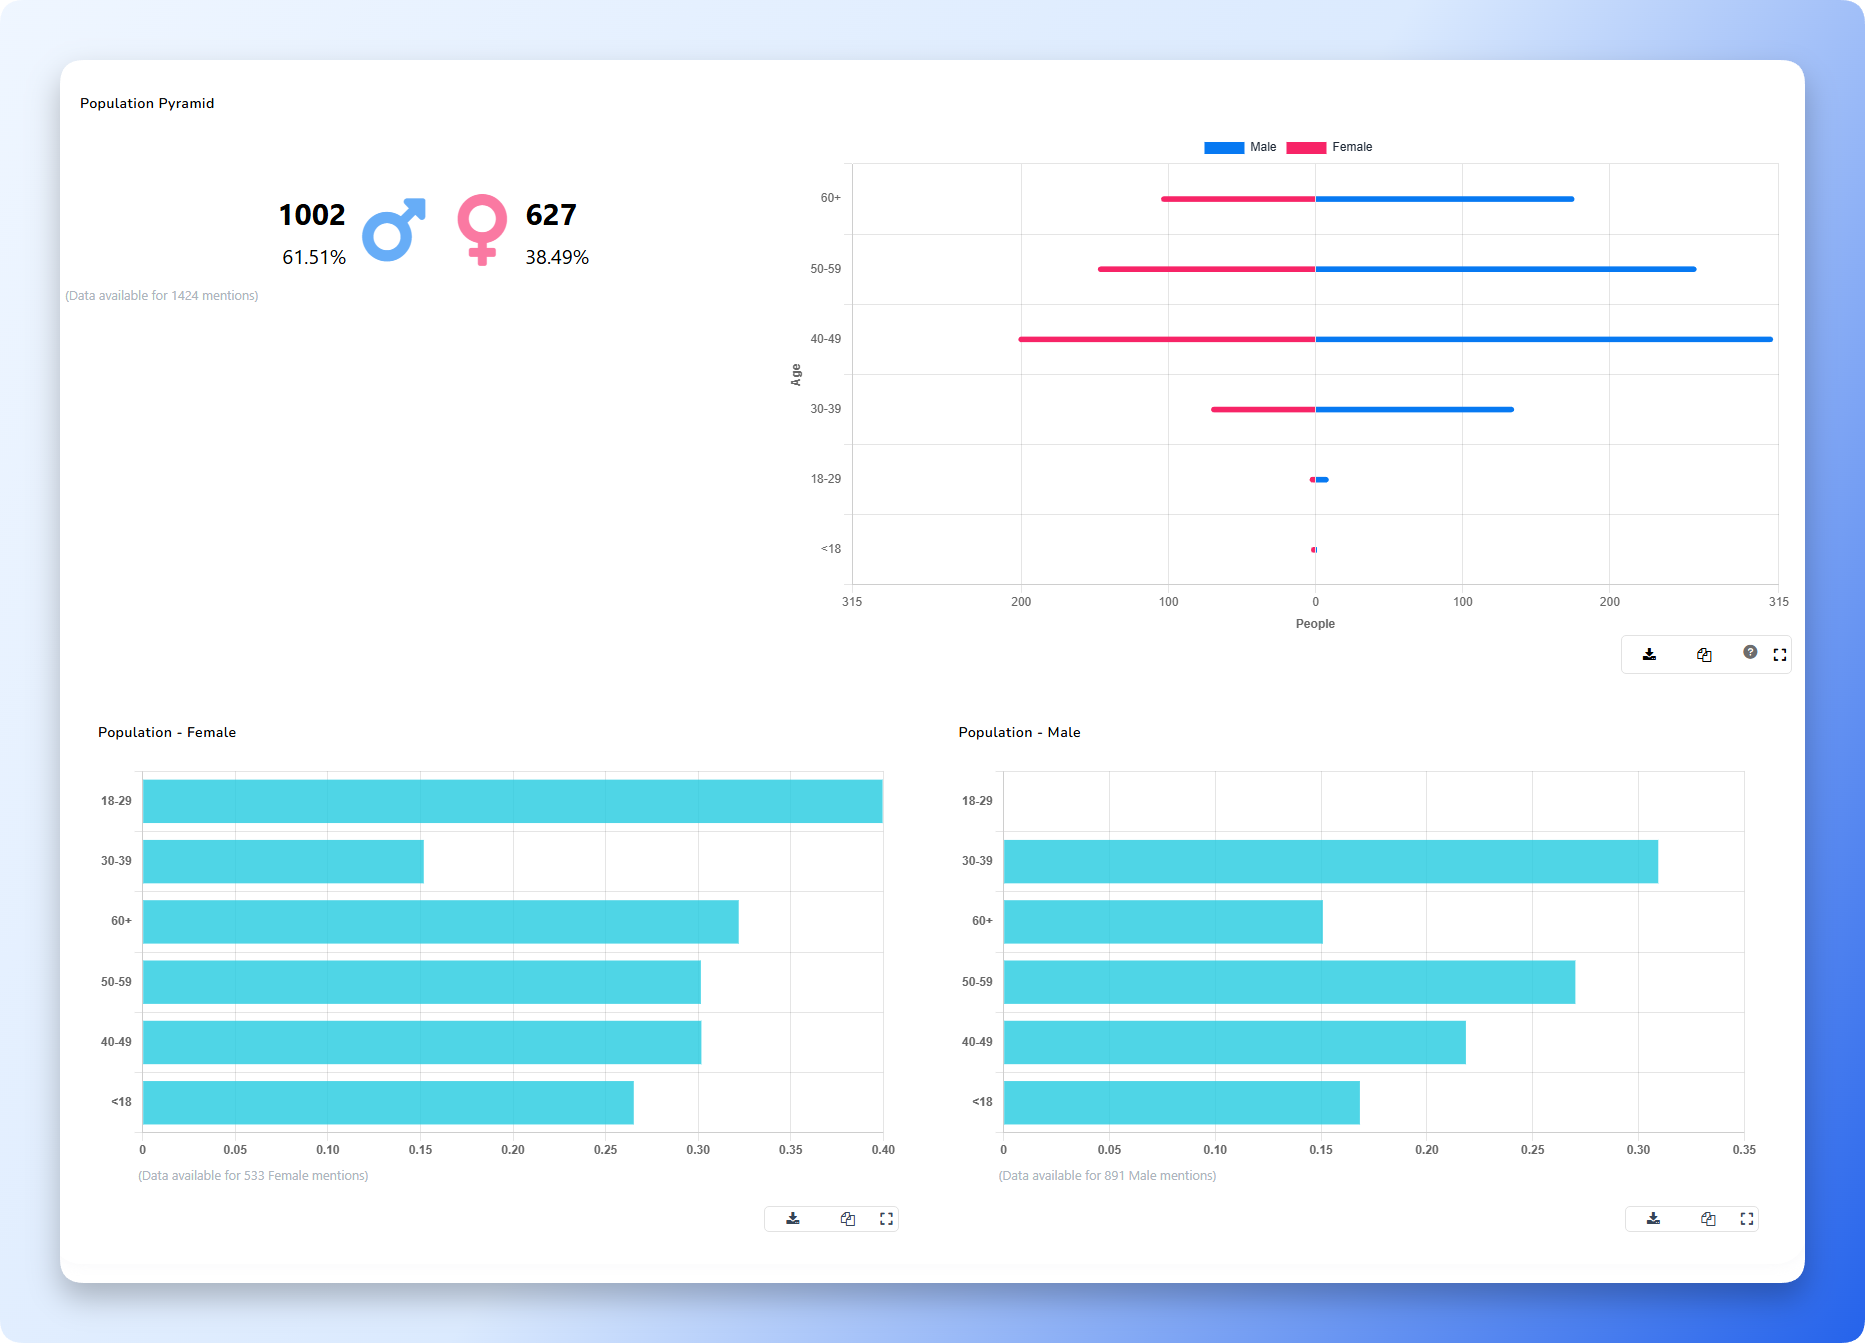
8.1.6 Age Distribution & Population Pyramid
Age breakdown charts and the population pyramid show:
- Participation by age groups.
- Age–gender comparisons.
- Relative engagement across generational segments.
These visualisations help you understand which age cohorts are most active in mentioning your brand.
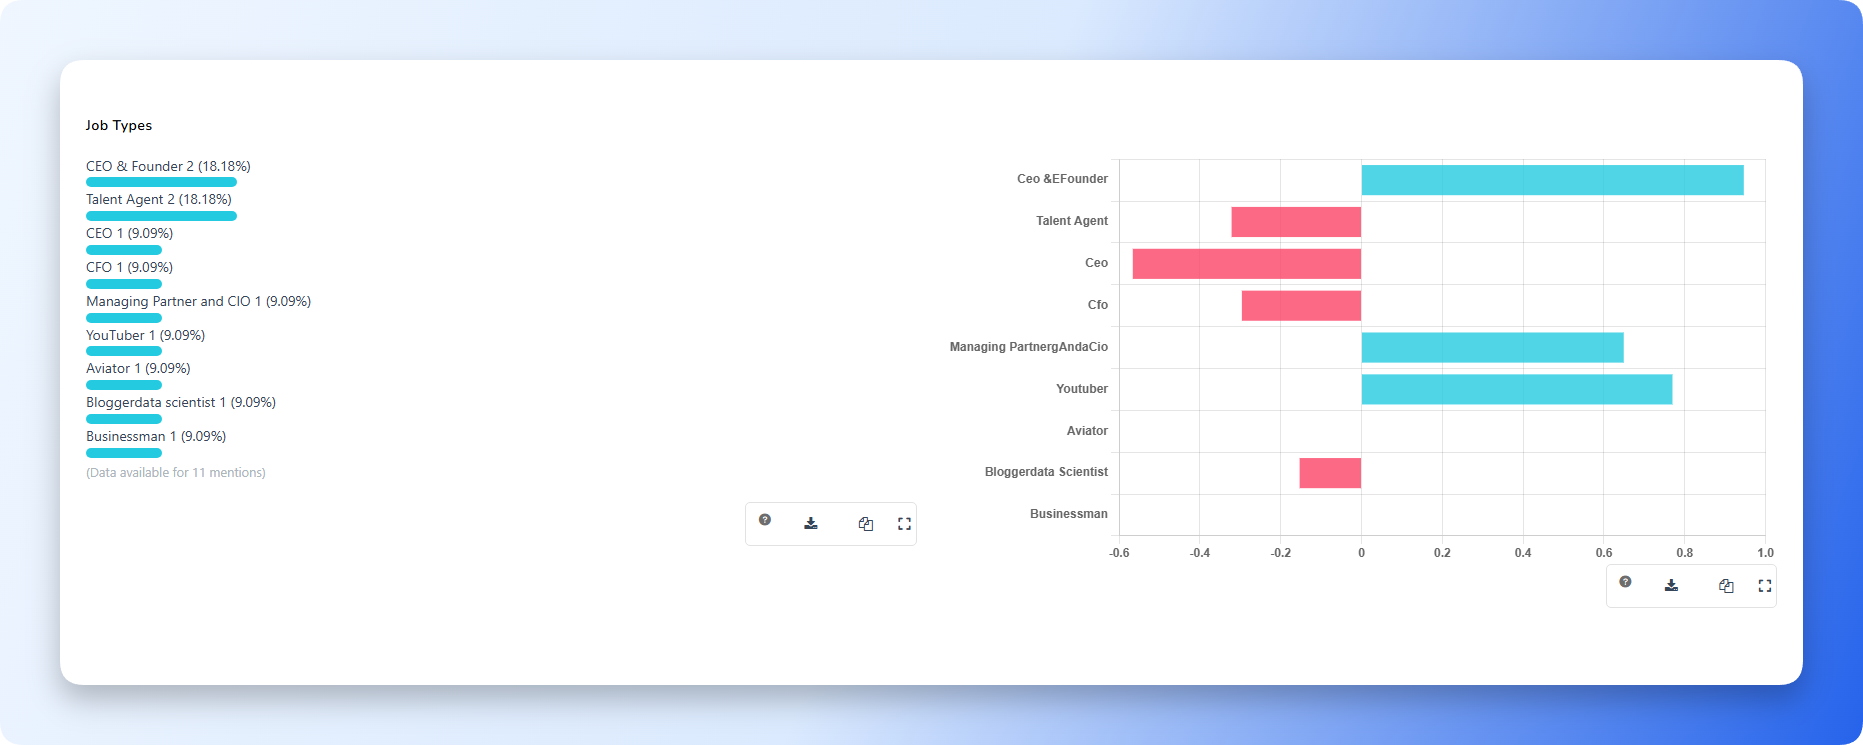
8.1.7 Occupation Breakdown
Where occupation data is available, mentions are grouped by job title or profession.
This helps determine:
- Which professional groups engage most.
- Whether discussion is linked to certain industries.
Conclusion
The Demographics tab provides a comprehensive view of who is driving conversations around your brand. By analysing age, gender, location, nationality, language, occupation, and account type, you can better understand your audience’s makeup and engagement patterns. These insights support smarter targeting, improved content decisions, culturally relevant messaging, and a clearer picture of the communities interacting with your brand.