

Overview Tab Metrics
Understand the core KPI tiles and trend graph in the Kommon Poll Overview tab.


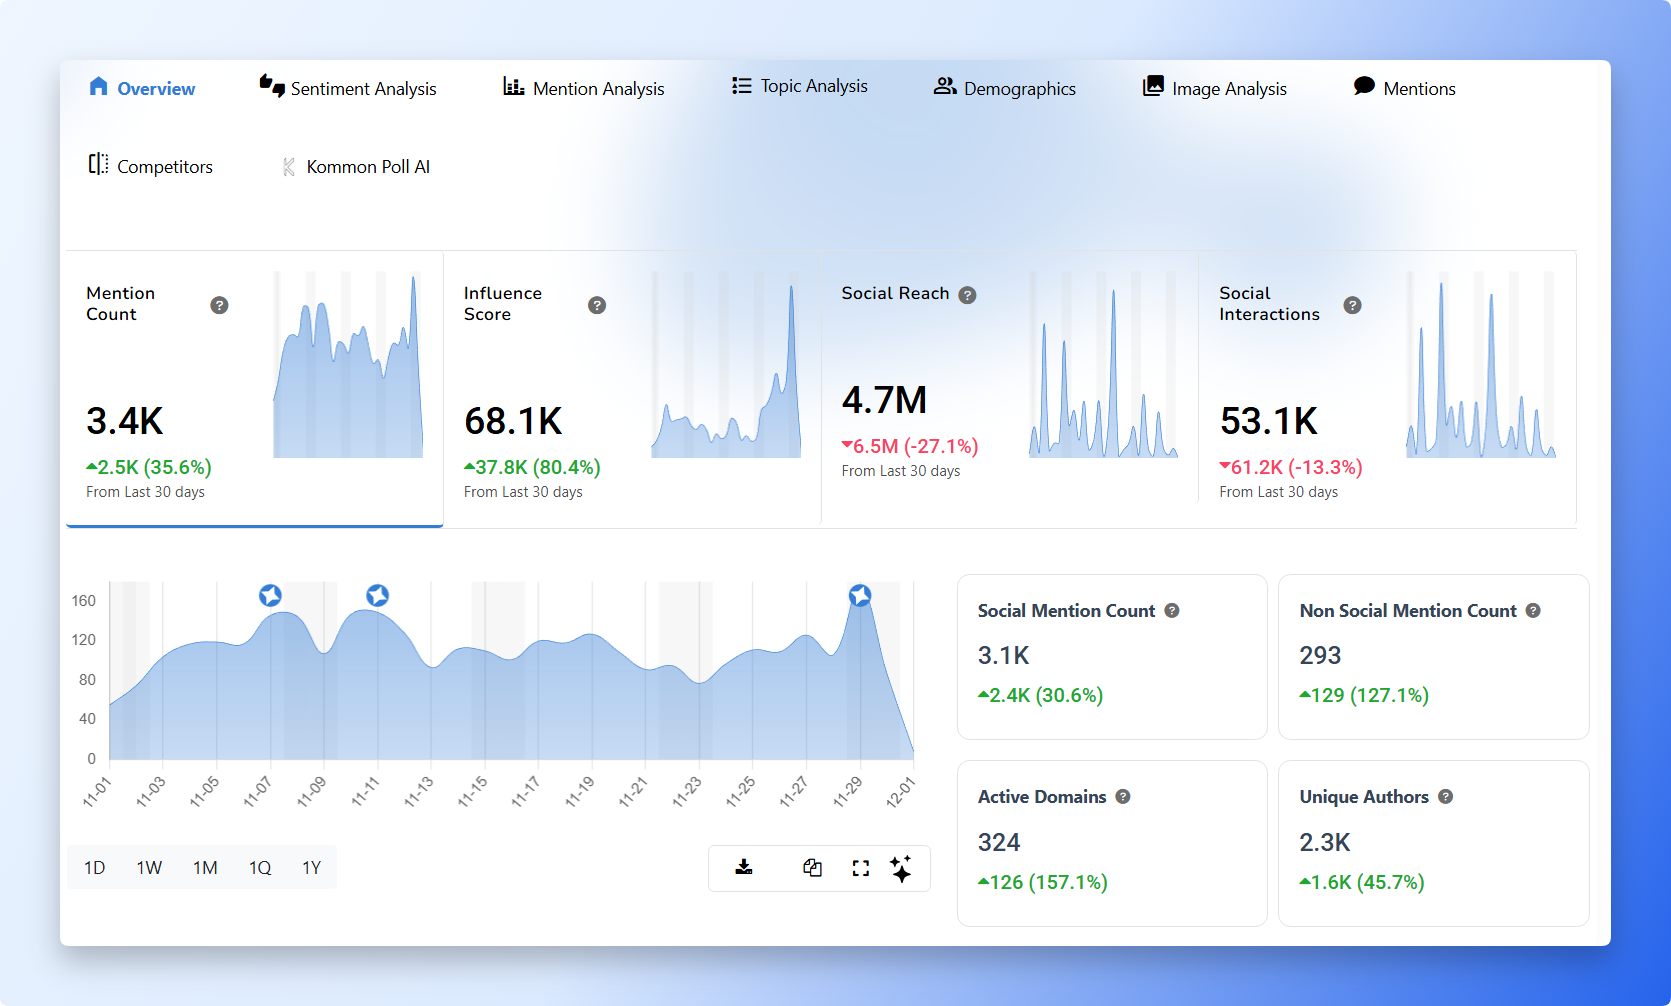
The Overview tab provides a simplified guide to the core KPIs that matter most for real-time monitoring.
Overview Metrics (Top Section)
1. Mention Count
Total number of mentions detected during the selected time period. Shows overall conversation volume around your topic or brand.
2. Influence Score
Represents how impactful the conversation is. Higher values indicate mentions coming from strong, active, or authoritative profiles.
3. Social Reach
Total potential audience that could have seen the collected mentions. Based on follower counts, visibility, and platform reach.
4. Social Interactions
Total engagement received on social content mentioning your brand. Includes likes, comments, shares, reactions, and similar actions.
Additional Overview Insights (Lower Section)
5. Social Mention Count
Number of mentions coming only from social media platforms. Reflects how active your brand is across Facebook, Instagram, TikTok, X, LinkedIn, etc.
6. Non-Social Mention Count
Mentions from sources like blogs, news sites, forums, and other web content. Useful for tracking PR coverage and media discussions.
7. Active Domains
Number of unique websites producing mentions. Helps understand how many external sites are talking about you.
8. Unique Authors
Total number of distinct users contributing to mentions. Indicates whether the conversation is wide and diverse or driven by few voices.
9. Mention Trend Graph
A time-based graph that visualizes daily mention activity across the selected time frame. Helps identify peaks, spikes, and patterns.
Summary
The Overview tab gives a clear snapshot of how widely your brand is being discussed, who is driving those conversations, and how far the content is spreading across social and non-social channels. These tiles, combined with the trend graph, reveal the pace and impact of your brand’s online presence.