

Emoji & Intent Analysis
Understand how users express reactions through emojis and what their underlying intentions are in mentions.


Understand how users express reactions through emojis and what their underlying intentions are in mentions.
Kommon Poll helps you move beyond basic sentiment by analysing emoji usage and user intent. These insights give you a clearer picture of how people feel and what actions they expect from your brand.
6.2.1 Emoji Analysis
Emoji analysis allows you to understand emotional reactions expressed through emojis in conversations.
🔎 How to Access Emoji Analysis
- Open your project/search.
- Go to the Mention Analysis tab.
- Select Emoji Analysis.
You will now see a view similar to the provided image, which includes:
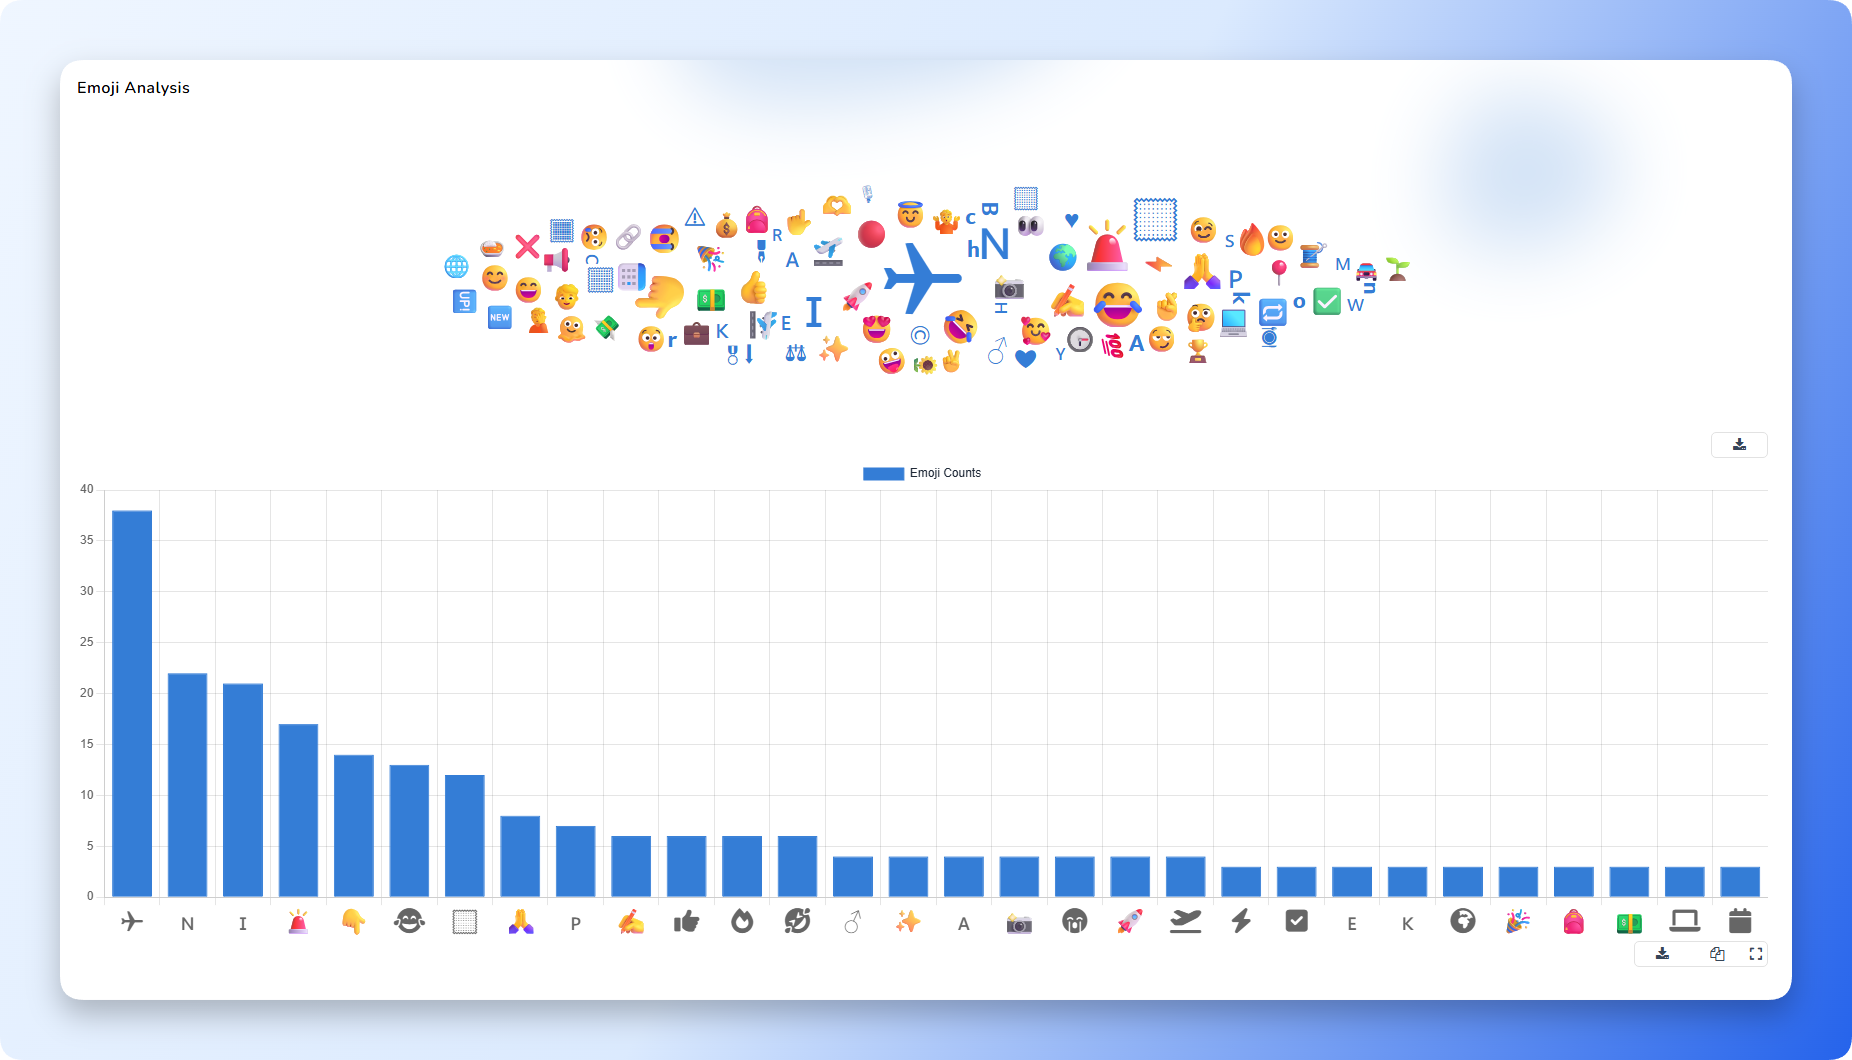
📌 What You Will See
- Emoji Cloud
A visual cluster of the most frequently used emojis. Larger emojis represent higher usage.
- Emoji Count Chart
A bar chart showing how many times each emoji was used in the captured mentions.
This helps identify:
- Most dominant reactions
- Positive and negative emotional patterns
- Which emojis appear during spikes or key events
📘 How to Use Emoji Insights
- Identify emotional drivers behind key conversations
- Detect early warning signals (e.g., sudden rise in 😡 or 😭)
- Recognize positive waves during campaigns (🔥 😍 🙌 ❤️)
- Add visual clarity to reports (“Users reacted with 😡 and 😭 during the outage”)
6.2.2 Intent Analysis
Intent analysis helps you understand what users are trying to achieve in their mentions — whether they are complaining, asking questions, praising, requesting support, or sharing feedback.
🔎 How to Access Intent Analysis
- Go to the Sentiment tab of your project/search.
- Scroll to the bottom of the page.
- You will find the Intent Analysis section (same as shown in the provided image).
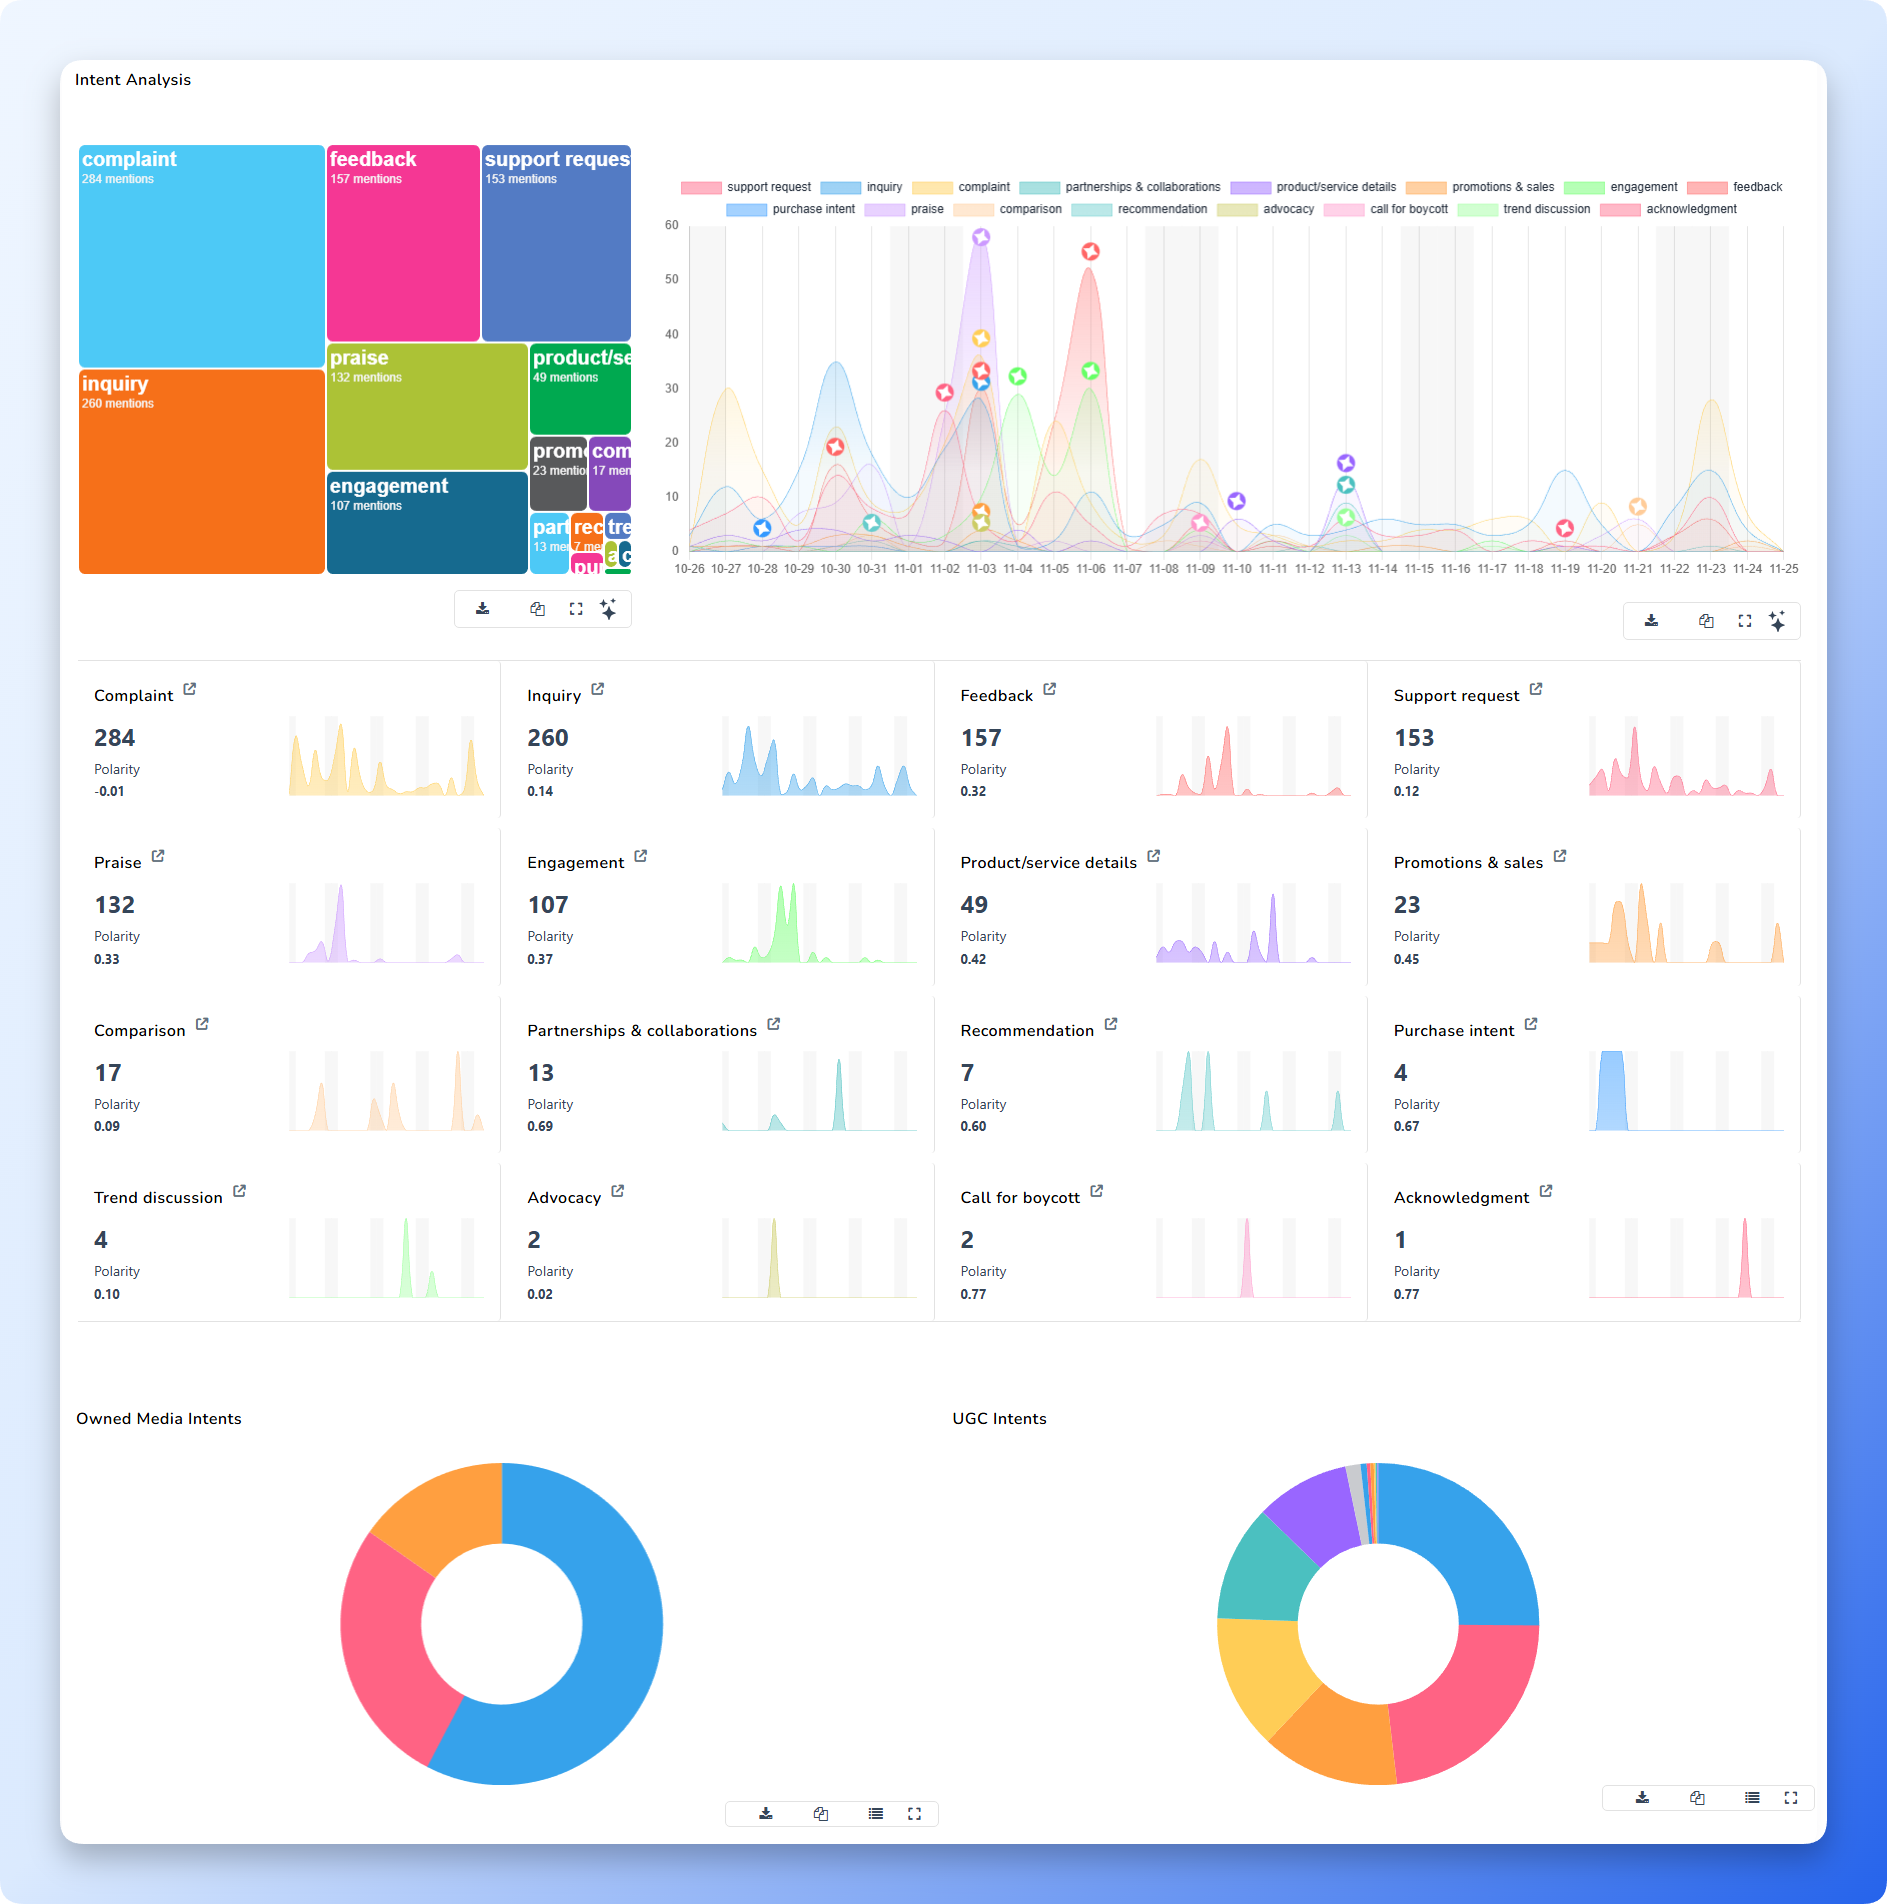
📌 What You Will See
Intent Analysis includes:
- Intent Blocks / Heatmap
Colour-coded blocks representing each intent category (e.g., inquiry, complaint, praise, engagement, promotions).
Each block shows:
- Intent type
- Number of mentions
- Intent Trends Over Time
A line/area graph showing intent distribution across selected dates.
This allows you to identify:
- Which intents spike during specific events
- Whether complaints, inquiries, or praises are rising
- Seasonal or campaign-related behaviour
📘 Common Intent Categories
- Inquiry
- Complaint
- Support request
- Praise
- Feedback
- Engagement
- Promotions & sales
- Product/service details
- Comparisons
- Advocacy
📘 How to Use Intent Insights
- Prioritize operational responses:
- Complaints → Support teams
- Inquiries → Sales or social care
- Praise → Marketing & community
- Understand what customers need at different times
- Detect hidden issues (e.g., sudden rise in complaint intent)
- Support decision-making for campaigns and service improvements
Summary
By using Emoji Analysis and Intent Analysis:
- You gain deeper behavioural insights beyond sentiment
- You understand both emotional reactions and user motivations
- You can respond smarter and faster based on what customers express and expect