

Topic Analysis
Topic Analysis helps you understand what people are discussing most about your brand or project.


Topic Analysis helps you understand what people are discussing most about your brand or project.
Topic Analysis helps you understand what people are discussing most about your brand or project. By setting focused topics, you can view structured insights, trends, and sentiment across the areas that matter to you.
7.1 Setting Up Topics in Your Saved Search
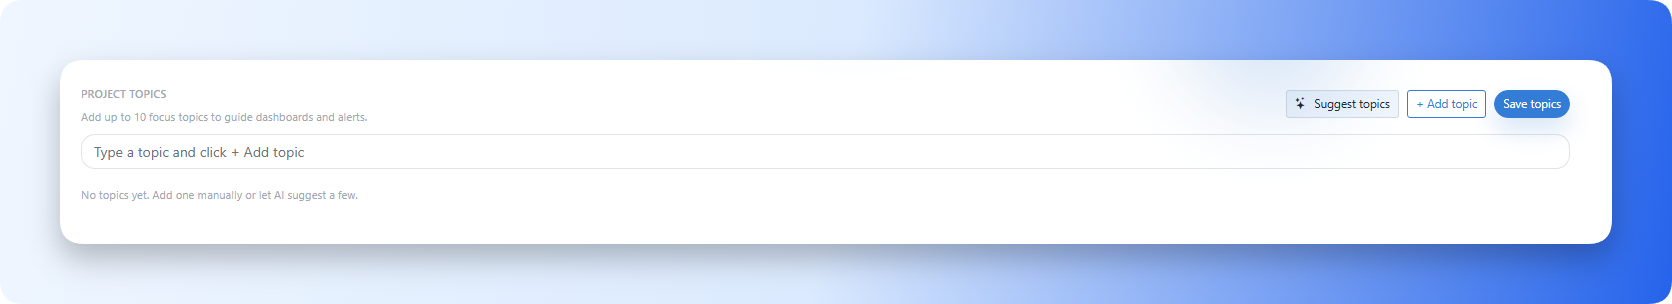
When creating or editing a Saved Search, you can define Project Topics that guide dashboards and analysis.
How to Set Topics
You can set topics in two ways:
1. Manually Add Topics
- In the Project Topics section, type a topic name that reflects what you want to track.
- Examples:
- Customer service
- Online banking experience
- Security and privacy
- Interest rates
- Click Add topic to include it in your list.
2. Generate AI-Suggested Topics
- If you're unsure what to add, click Suggest topics.
- The AI will automatically generate relevant topics based on your brand, industry, or search content.
- You can accept, edit, or remove any suggested topic.
3. Edit Topics Anytime
Even after saving your search:
- You can return to the Project Settings.
- Add new topics, rename existing ones, or delete topics you no longer need.
- The dashboards will update accordingly.
7.2 Topic Analysis Overview
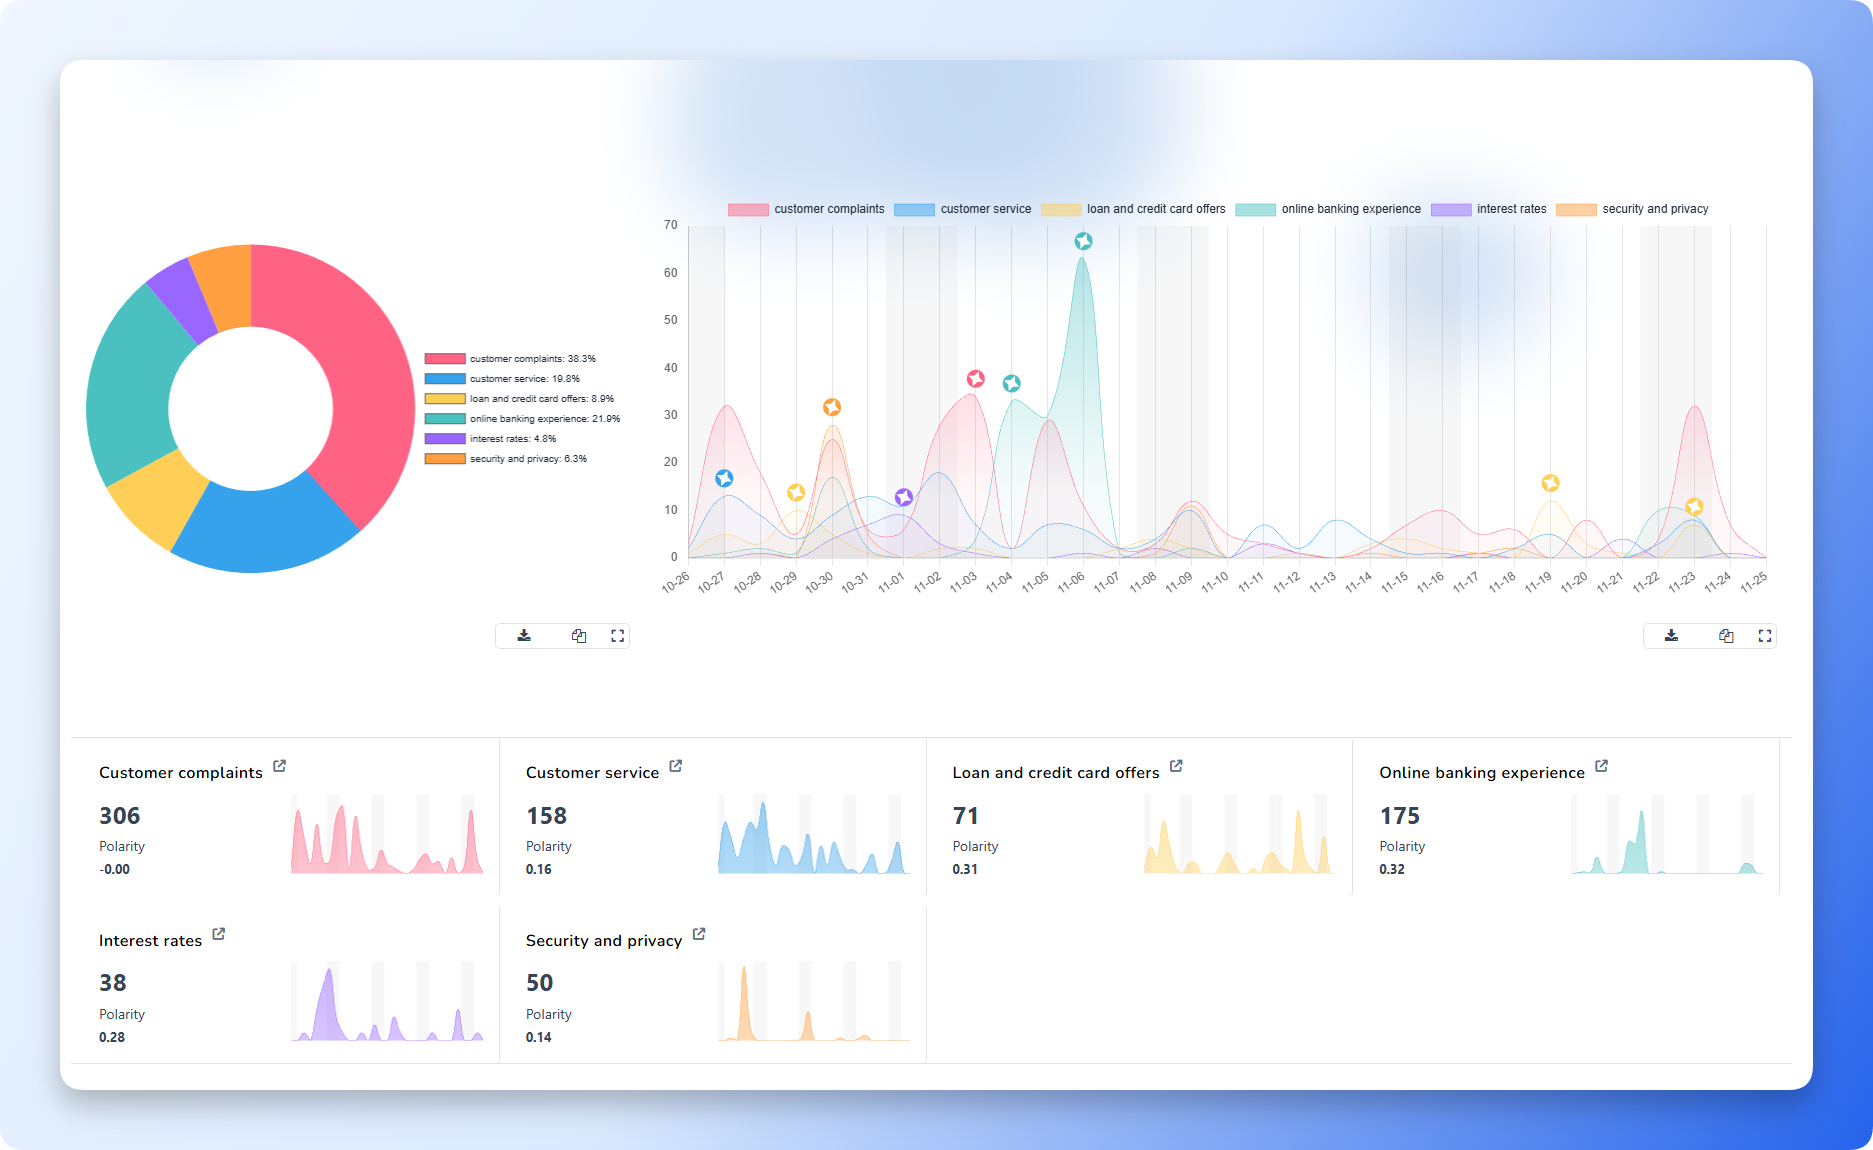
After setting and saving your topics, the Topic Analysis tab displays insights for each topic.
This dashboard provides a clear picture of how your topics appear across conversations, using visuals similar to those shown in your screenshot.
What You Will See in Topic Analysis
1. Topic Distribution Chart
- A donut or bar chart showing each topic’s share of total mentions.
- Helps you identify which areas dominate customer discussions.
2. Topic Trend Graph
- A timeline showing how mentions for each topic rise or fall over time.
- Useful for spotting spikes in complaints, interest, or service discussions.
3. Topic Cards (Individual Topic Insights)
Each topic is displayed with:
- Total mention volume
- Sentiment polarity score
- A mini trend chart showing recent fluctuations
This gives you a quick and actionable overview of how each area is performing.
7.3 Trending Keywords & Entities
A complete guide to understanding the most actively discussed keywords, entities, and themes within Kommon Poll.
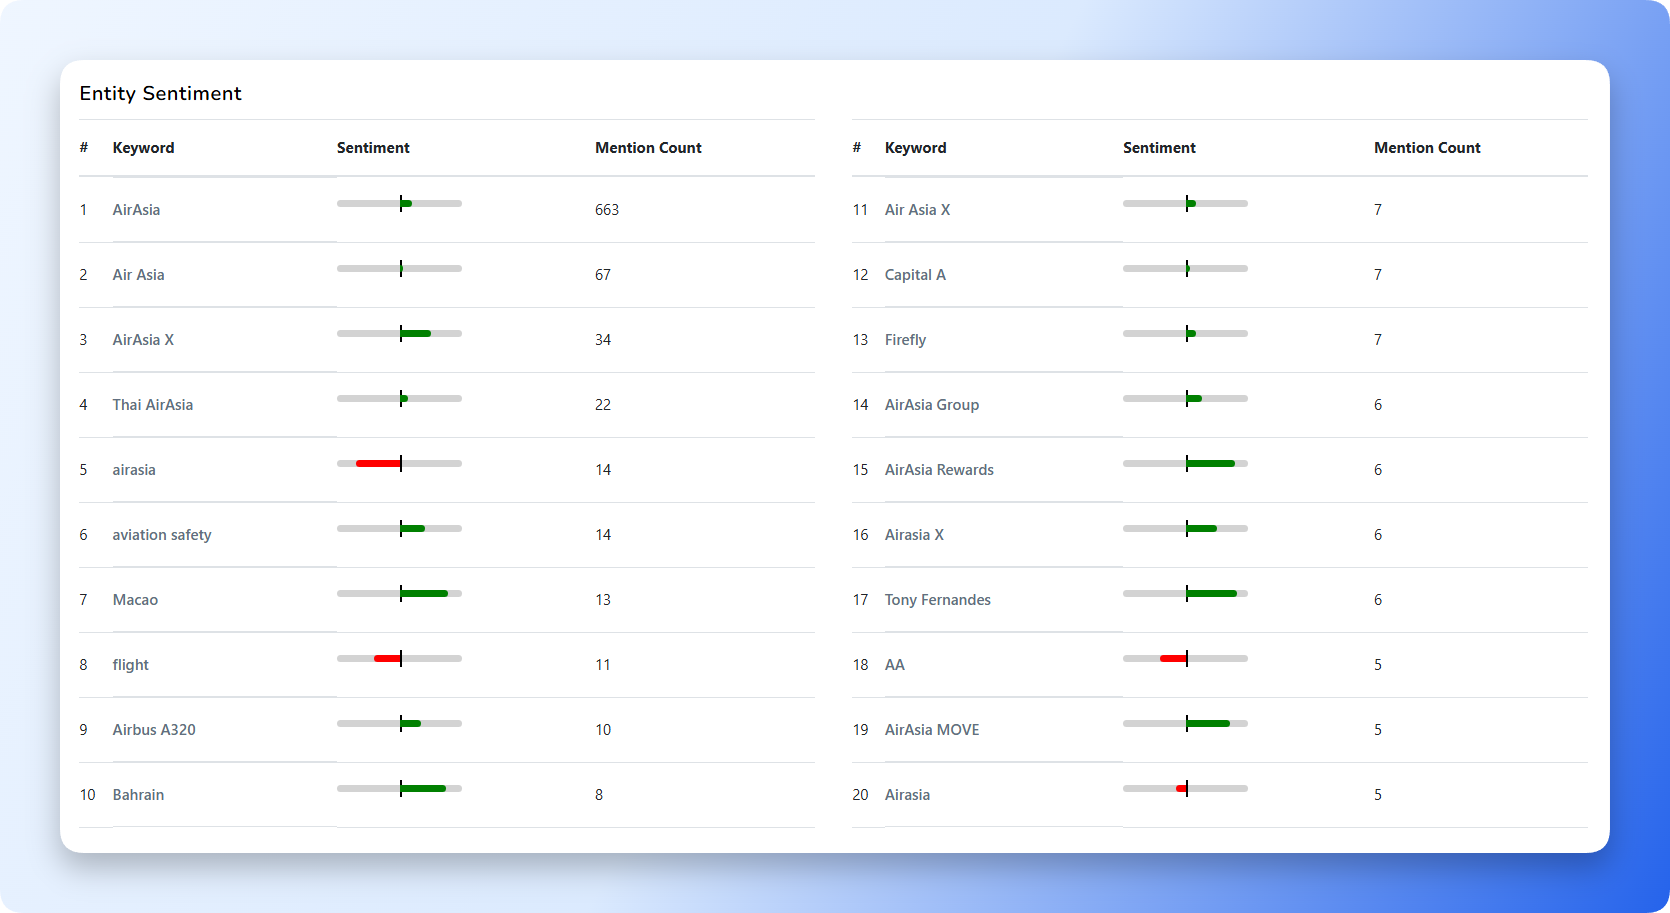
7.3.1 What the Trending Keywords Table Shows
Each row delivers three key insights:
Keyword / Entity
Shows the exact term extracted from conversations, including brands, products, locations, or broader themes that are appearing most frequently.
Sentiment Indicator
A colored bar highlights whether sentiment is predominantly positive (green), negative (red), or mixed/neutral (gray) so you can prioritise follow-ups.
Mention Count
The raw number of times the keyword appeared, signalling visibility, growth, or emerging issues that might need attention.
7.3.2 Why Trending Keywords Matter
- Understand conversation priorities by seeing which topics dominate brand or industry chatter.
- Track brand visibility through the keywords that include your brand names or variations.
- Detect issues early when a high-volume keyword carries growing negative sentiment.
- Guide content and campaign planning with the themes people are already discussing.
- Monitor competitors when their names or product terms spike in mentions.
7.3.3 When to Pay Attention to a Keyword
Watch keywords that:
- Jump to a high mention count quickly.
- Carry strong positive or negative sentiment signals.
- Appear across multiple platforms simultaneously.
- Link to ongoing events, product launches, or service issues.
- Include customer praise, complaints, or feedback.
- Rise rapidly over short periods, hinting at emerging trends.
7.3.4 Recommended Use Cases
Use the Trending Keywords view for:
- Weekly or monthly reporting.
- Competitor benchmarking.
- Crisis and issue detection.
- Campaign opportunity identification.
- Understanding customer expectations.
- Tracking PR and media impact.
Summary
Topic Analysis helps you convert raw conversations into meaningful insights.
By setting your topics during the Saved Search setup—either manually or using AI suggestions—you ensure the analysis dashboard focuses on what matters most to your brand or project. Once saved, the Topic Analysis tab displays visual trends, distribution charts, and topic-specific insights that allow you to quickly understand customer behavior and discussions.